
Intent Classification
Intent Classification uses machine learning and natural language processing to automatically associate words and expression with a particular intent and, in essence, an intent classifier automatically analyzes user inputs and categorize them into intents in order to better understand the intentions behind end-users' queries, automate processes and gain valuable insights. Teneo provides the possibility to create an intent classifier where machine learning algorithms allow to build a model based on the provided training data to be used for making predictions.
Teneo provides two options to train an intent classifier model:
- Teneo Learn: Teneo Learn is the out-of-the-box intent classifier in Teneo and Teneo Studio allows to add training data and train the machine learning model automatically each time changes are performed to the training data (i.e., addition or removal of classes and/or training data)
- Conversational Language Understanding (CLU): CLU is one of the custom features offered by Azure Cognitive Service for Language, it is a cloud-based API service that applies machine-learning intelligence to enable developers to build natural language understanding components to be used in end-to-end conversational application. Teneo integrates with CLU and provide developers with the possibility to create, maintain and test CLU models directly in Studio.
The Teneo Predict Input Processor uses the trained model at runtime to determine to which intent class/classes a user input most probably relates. Teneo Predict creates annotations for the most probable intent(s) and denotes these with a confidence score. Intent classification in Teneo is designed to associate an input with one class - the most probable one - but in cases where the predictions aren't clear and several classes could be the potential one, multiple annotations are created.
To improve performance of the intent model in a solution, Teneo offers:
- Class Performance
- Cross Validation: run Cross Validation (CV) on a Learn model in order to estimate the performance of the model
- Test Data Evaluation: run an evaluation making use of the Test Data provided in Class Manager and as Linked Training Examples (applies to both Learn and CLU)
- Classifier: the workbench of the classifier which, based on real inputs coming from logs, allows users to review how the model performed and based on the information improve the model balance, assign specific inputs to a class or fix detected misclassifications.
Learn Intent Classifier
When Teneo Learn trains a machine learning model, the machine learning pipeline is automatically selected by using an algorithm which assigns a pipeline optimized to the number of provided training data examples. Every change to any of the classes in the Class Manager, including addition or removal of one or more classes, activates a new training in Learn as soon as the developer saves the changes in Studio.
Input Processing
Tokenization
For the Learn Intent Classifier to generalize well on unseen user inputs, the user inputs are pre-processed so that irrelevant features such as punctuation characters or casing do not have an impact on the machine learning prediction.
In general, this means that user inputs are lowercased, and certain punctuation characters are removed. The following table holds several user inputs in English which are normalized to the same form and as such the Intent Classifier makes the same prediction for them.
| User inputs |
|---|
| Hello, how are you? |
| Hello. How are you? |
| HELLO HOW ARE YOU?? |
| hello how are you |
It is vital that the exact same pre-processing that is applied to the user inputs at runtime for the intent prediction is applied to the training data examples that are used to train the model. This means that pre-processing happens in two places: once for the training data examples in Teneo Studio and once at prediction time when the model is called in the Teneo Predict Input Processor.
Pre-processing
For the pre-processing, the language specific Teneo Input Processors (IPs) are used since they are tailored for the needs of each language. The final pre-processing string will be a concatenation using a single whitespace character " " of all the FINAL wordforms of all sentences for a user input.
Note that the order of the input processors in the chain matters and all input processors that modify the ORIGINAL, SIMPLIFIED or FINAL word form before the Predict Input Processor impact on the actual prediction. Input Processors that are placed after the Predict IP in the chain do not affect the intent classification.
Configuration
For each language, the chain of input processors used to normalize the data is defined explicitly in the language-specific Input Processor configuration file. The configuration file has a mandatory property which takes as argument an ordered, comma-separated list of the Input Processors which are applied when normalizing the data. Be aware that the Input Processors defined in the above-mentioned property must occur in the same order in the definition of the input processor chain before the Predict Input Processor and that input processors which modify the FINAL wordform do not occur before the Predict IP in the definition of the chain if they are not explicitly mentioned in the right order in the property. Note that the Simplifier is always run when normalizing the data and usually affects the FINAL wordform and thus the normalized input.
The following table shows the Input Processors which are used by default to normalize the data; again, note that per default the Simplifiers are also applied.
| Language | Input Processors |
|---|---|
| Standard (all languages except below) | Standard Splitting, Standard Auto Correction |
| Chinese | Chinese Tokenizer IP |
| Finnish | Standard Splitting, Finnish Splitting, Standard Auto Correction |
| Japanese | Japanese Tokenizer, Japanese Concatenator |
| Turkish | Turkish Analyzer |
Please see language specific information in the Input Processors section.
CLU
Conversational language understanding (CLU) enables users to build custom natural language understanding models to predict the overall intention of an incoming utterance and extract import information from it. CLU only provides the intelligence to understand the input text for the client application and doesn't perform any actions.
Source: Azure Cognitive Service for Language documentation (May, 2023)
Teneo allows to integrate with CLU seamlessly and build, customize and test CLU models directly within Teneo Studio. When a CLU model is trained in Teneo Studio, the actual training takes place in the Cognitive Services layer in the Azure ecosystem and when done the model becomes available in the CLU Manager within Studio for the developer to assign it to the solution.
Depending on the language, within Teneo, inputs may be lowercased, but no further input processing is applied.
Generation of Annotations
Whenever a user input is received by Teneo Predict, a confidence score for each and one of the classes is calculated based on the model (trained either with Learn or CLU) and annotations for the most probable intent classes for that input are created following the scheme <CLASS_NAME>.INTENT; the intent annotations also contain the classifier that is used in an annotation variable (i.e., Learn or CLU). For the class with the highest confidence score (i.e., the most probable one), Teneo Predict generates a top-rated annotation tagging it with the TOP_INTENT suffix.
By default, Predict generates annotations for up to five intent classes and these annotations are created only if the difference in the confidence between an intent and the top intent is than TOP_INTENT divided by two. As an example, imagine the model predicts these top five intent classes for a particular user input:
A 0.14
B 0.11
C 0.06
D 0.05
E 0.03
Teneo will only generate the following annotations:
A.TOP_INTENT confidence 0.14
A.INTENT confidence 0.14
B.INTENT confidence 0.11
In this example, there are no annotations for C, D, nor E. The reason for this is that the confidence values of C (0.06), D (0.05), and E (0.03) are lower than TOP_INTENT (0.14) divided by two (0.07).
See the Predict Input Processor section for further details.
Global Confidence Threshold
The confidence threshold of the Intent Classifier defines the minimum confidence value the model must assign to a class in order for a Class Match to be considered for triggering. The confidence threshold is a numeric value between 0 and 1. By default, the confidence threshold is 0.45, but it can be modified in the Solution Properties.
Class Performance
It is possible to evaluate the Intent Model directly in Teneo Studio Desktop either by running a Test Data Evaluation or - if using Learn - by running Cross Validation.
Test Data Evaluation
Test Data Evaluation is a statistical method for testing a machine learning model based on a set of test data. Test data evaluation is available in the Class Performance area in the backstage of Teneo Studio and it allows to evaluate the model currently assigned to the solution, i.e., either CLU or Learn.
In Studio, test data comes from two sources:
- test data examples which are part of a class document directly and managed in Teneo Manager
- linked test examples which are the positive examples of User Intent on a trigger/transition which refers the class document in a Class Match.
When evaluating the model, both the test examples that are part of the class document and the linked test examples are used, and predictions are made for each test example where the results are aggregated into metrics. Note that duplicated test examples are removed from each class automatically.
The actual evaluation happens as follows:
- for Learn, the model is loaded directly in the backend and then queried with the test data
- for CLU, the runtime model on the CLU server is queried with the test data.
Cross Validation
Cross Validation is a statistical method for estimating the performance of a Learn machine learning model. In Teneo Studio, this process is available via the Class Performance functionality allowing users to check the performance of the Learn model and analyze which classes conflict with one another and, basically, it is a method in which the model is trained using a subset of the training data and then evaluated using the complementary subset of the training data in order to get an estimation of the performance. The results are then displayed to the user in the Confidence Threshold graph and the Class Performance table where it is possible to compare one cross validation process with others run previously.
Process
The evaluation is performed using a k-fold cross validation process, where all the training data of the solution's classes are split into K folds and, for each fold, a machine learning model is trained with the rest of the K-1 folds. Once the training is completed, the performance of the machine learning model is evaluated against the retained fold and the results of all these evaluations are averaged to get an estimation of the performance of the Learn model.
It is important to remember that cross validation is an estimation of the performance of the model which can only be directly measured with a test data set and that it is stochastic in nature. This means that different executions of the cross-validation process may give different results because the training data is randomly split into folds. Results would probably be stable for homogeneous classes with a high number of training data and a high variance could be a symptom of excessive heterogenicity among the training data examples of some classes.
Metrics
The metrics used to evaluate the performance, both when running Test Data Evaluation and Cross Validation, are standard metrics for performance measurement of machine learning models and an in-depth description can be found on Wikipedia.
- Precision measures the percentage of the detected classes which were really positive matches, i.e., measuring to which degree one can rely on the Classifier having marked as positive only data that is positive.
- Recall measures, from all the positive matches, how many of them were successfully retrieved, i.e., measuring how sure the Classifier is of having retrieved all the existent positives in the dataset.
- F1 is the harmonic means of Precision and Recall; it is usually used as a general measure of classifier performance.
Data Limitations
Old executions of class performance are kept in Teneo for comparison purposes, but historic data has some size and time limitations:
- Failed executions are kept for one week after which they are removed from the server.
In case the Studio backend service gets restarted while a validation or data evaluation is running, the process will be stopped and marked as failed and, in this case, the user has to start the process again. - There is no time limitation for succeeded validations or data evaluations, but the number of executions stored in the server is limited; by default, only the last 20 are kept but this configuration may be changed in the server.
Test Results
The test results of both a Learn Cross Validation and a Test Data Evaluation of either Learn or CLU are displayed in the Confidence Threshold Graph and the Class Performance Table; both of these are described further in the following sections.
Confidence Threshold Graph
Whenever a new input arrives to the conversational AI application, the machine learning model analyzes that input and generates a set of class predictions, i.e., for each class in the model it assigns a probability for the input to belong to that class. A top intent annotation is always created for the most probable class, and if the probability value exceeds the solution-wise confidence threshold, that class is considered for triggering (the trigger actually selected also depends on other factors in Teneo, for example, Ordering, other defined Matches, etc.).
The solution threshold is set up under the assumption that predictions with a very low degree of confidence will most likely be wrong. So, the thresholding process can be thought of as a binary classifier that determines whether the predictions of the machine learning model are reliable for a given input or not (based only on the prediction confidence).
The purpose of the Confidence Threshold Graph is to provide a tool to analyze the estimated performance of the classes in the solution with regard to this threshold setting.

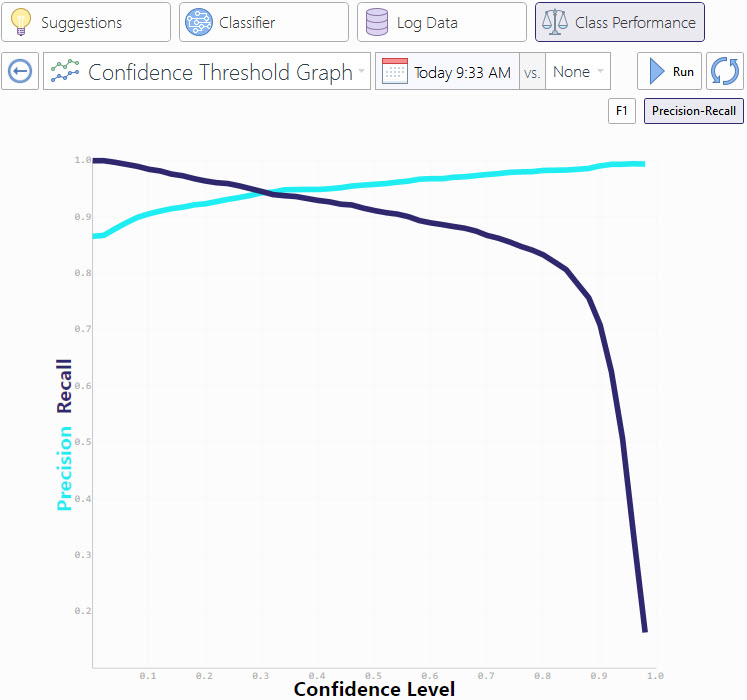
The view shows the values of the classification metrics for the thresholding process for each value of the confidence threshold, in the [0, 1] range, i.e., considering the threshold a binary classifier whose training data is accepted predictions of the model (predictions with confidence over the threshold) and whose negative training data is rejected predictions (predictions with confidence values below the threshold).
In this context, the performance metrics can be interpreted in the following way:
- Precision measures the percentage of the accepted inputs (classifications with a confidence over the threshold) that were rightfully accepted, i.e., they correspond to data that was correctly classified by the model.
- Recall measures the percentage of the correct inputs (data that was correctly classified by the model) that were accepted by the threshold.
- F1 has the usual meaning as the harmonic mean between the other two metrics.
The values on this graph can be used to decide where to set the solution confidence threshold. There is no golden rule to set this value, but when taking the decision, consider the following pieces of advice:
- A high threshold value will reject dubious predictions, so if the solution contains triggers which depend on the classes, it will be highly improbably to mistakenly trigger a Flow based on the machine learning predictions. On the other hand, this will cause may correct predictions to be discarded due to a low confidence score. A high threshold is probably wanted when the consequences of marking a wrong input as positive is worse than those of marking them as negative (a typical example is spam classifiers).
- A low threshold value will make the solution accept more predictions, so one can be confident that most of the times a Flow should be triggered by a machine learning prediction it actually will. Conversely, this will increase the probability of triggering a Flow with an incorrect prediction. One probably wants a low threshold when the consequences of losing one message are worse than those of processing an incorrect one (emergency services would be a typical example).
Setting the threshold implies a trade-off between these two situations, the appropriate value will depend on the particular use case and project.
Class Performance Table
The Class Performance Table shows the performance metrics for each of the classes in the solution, including how many errors correspond to false positives (FP), which are those prediction where the classifier assigned that class when it should have assigned another, and to false negatives (FN), which are those predictions where the classifier assigned another class when it should have assigned the analyzed one.

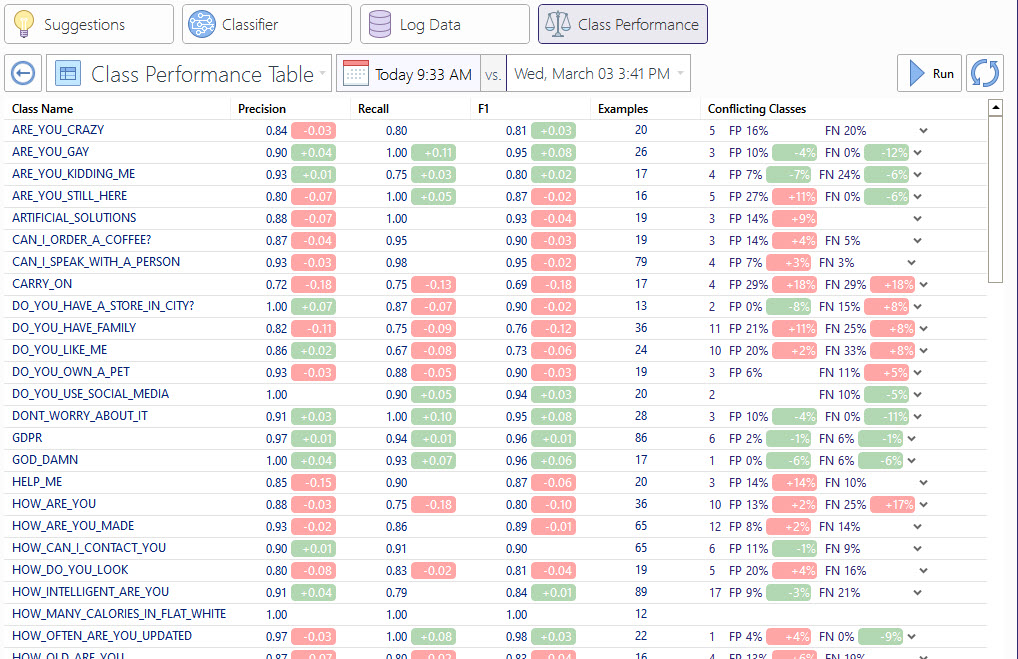
The table displays one row for each class and a single row for the average values for all classes. For each row, the following columns are displayed:
- Class name: name of the class
- Precision, Recall, F1: these are the binary classification metrics for the row's class, i.e., for all the data examples whose ground truth class is the row's class, data examples predicted as belonging to that class are considered as positive and any other predictions as negative.
- Examples: number of training or test data examples of that class at the moment of the test/validation execution.
- Conflicting classes: shows the number of mistaken predictions of the model. Those predictions can either be false positives (FP) or false negatives (FN); the arrow at the end of the column unfolds a list of rows inside the cell, each one specifying one of the classes that were confused with the class of the row, the kind of error and the percentage of classified data that suffered from that kind of error for the particular class.
All the numeric columns and the class name are sortable, and classes which appear in the current execution but didn't exist in the historic ones are marked with a star.
If the user selected an old test execution to compare with, differences from the current run will be displayed as deltas on all the numeric values, with a green background if the metric has improved from the older executions and otherwise red.